Chapter 0.5: What the AI Office Actually Builds
Almost every chapter in this book uses an AI Office project as an example. If you don’t know what those projects are, the examples land flat. This chapter is a short field guide. Read it once. Refer back when an unfamiliar name shows up.
🧠 Remember. These are not props. Every project below is a real pipeline running on Databricks at King Hussein Cancer Center, reading and writing tables in the
aidi_catalogcatalog, with real outputs to real clinicians.
The setting: VistA, Databricks, and the silver/gold pattern
Patient data at KHCC lives in VistA, the electronic medical record. VistA is the source of truth: every clinic note, every lab result, every order, every pathology report.
VistA’s raw tables are messy. They were built to power the EMR, not to power analytics. So the AI Office (and the data engineering team) maintains a parallel set of tables in Databricks — a cloud data platform that holds large datasets cheaply and runs Python and SQL against them. The tables follow a convention:
VISTA_*— exact copies of VistA tables, refreshed nightly. Raw, ugly, fast.SILVER_*— cleaned tables. One row per patient encounter, dates parsed, units normalized, free text stripped of obvious noise. This is where most analyses start.GOLD_*— purpose-built tables for specific clinical questions. The AKI cohort lives here. The bone marrow transplant outcomes table lives here. So does the post-surgery infection cohort.
All of this lives inside the aidi_catalog in Unity Catalog (Databricks’ permissions system). When you see “the pathology silver table” in this book, the actual name is something like aidi_catalog.silver.silver_pathology_reports.
🔧 Technical Stuff. “Silver” and “gold” come from a popular data-engineering convention sometimes called the “medallion architecture.” Bronze = raw landing, silver = cleaned, gold = curated for a use case. You don’t need to memorize the metaphor; just remember that gold tables are what production pipelines query and what dashboards display.
The model and the toolkit
Every clinical pipeline at the AI Office uses the same general toolkit:
- Azure OpenAI is the LLM endpoint. The default model is GPT-4.1-mini — fast, cheap, structured-output-friendly. Bigger models (GPT-4.1, Claude, Llama) come out only for the hard cases.
- PydanticAI is the Python library used to force the LLM’s output into a known shape (specific fields, specific types). Think of it as the same thing you do in a CRF: you don’t accept free text, you accept a “yes/no/unknown” radio button. PydanticAI enforces that.
- Fernet encrypts patient names. Optimus encoding scrambles MRNs into reversible-but-not-human-readable identifiers. If an output ever escapes the secure system — into an email, a dashboard, a log file — names and MRNs are not in plaintext.
- The eval cohort is a frozen list of deceased patients with hand-curated ground truth. Every change to a prompt or extraction logic re-runs against this cohort and the diffs are posted to a Slack channel. If a change drops accuracy, the change does not ship.
Now the projects themselves.
1. The AKI Notification Pipeline
What it does. Every morning, the pipeline scans every adult inpatient’s serum creatinine trend for the prior 72 hours and applies the KDIGO criteria to detect acute kidney injury. KDIGO (“Kidney Disease: Improving Global Outcomes”) defines AKI by either a ≥0.3 mg/dL rise in creatinine over 48 hours, a ≥50% rise from baseline over 7 days, or urine output below 0.5 mL/kg/h for ≥6 hours. Stages 1, 2, and 3 are progressively worse.
What it produces. Each new AKI event triggers an automated email to the on-call nephrology team with the patient’s encoded MRN, the current creatinine, the baseline, the KDIGO stage, and a link to the dashboard. About a dozen events per day across the hospital.
Why it matters. AKI is one of the most common preventable causes of in-hospital morbidity and death. Catching stage 1 early — when it’s still reversible by stopping nephrotoxic drugs or fixing volume status — is the entire point. Before this pipeline existed, AKI was caught when somebody noticed during rounds, often too late.
Tech inside. Pure SQL for the cohort logic (KDIGO staging is deterministic — it’s arithmetic, not LLM judgment). One Python script for the email. Runs at 7 AM every day on Databricks. Eval cohort: 200 deceased patients with hand-graded AKI episodes, used to verify that no stage 2/3 events are missed.
2. The Pathology Extraction Pipeline
What it does. Pathology reports at KHCC are free text. A pathologist writes in prose: “Sections show a tan-pink tumor measuring 6.5 × 4.2 cm with predominantly favorable histology…” The pipeline reads each report and extracts a structured row: tumor size, tumor stage (T1/T2/T3/T4), nodal status, margins, histology subtype, grade, and so on.
What it produces. A row per report in a gold table that downstream researchers and clinicians can query without ever opening the original document. Powers the institutional tumor registry, the Wilms tumor outcomes cohort (Dr. Sultan’s own research), and the chemotherapy-protocol-assignment workflow.
Why it matters. A pathologist’s words are wisdom but not data. Every clinical question that starts “in patients with T2 tumors…” used to require somebody opening reports one by one. With extraction, the same question is a SQL query against a gold table.
Tech inside. Azure OpenAI GPT-4.1-mini, called via PydanticAI with a strict Pydantic schema (each field is a typed slot). One pass per report. Costs roughly $0.01 per report. Eval: 250 deceased-patient reports hand-extracted by a senior pathologist, used to measure F1 score per field. Currently above 0.90 on every field except margin status (which is genuinely ambiguous in the source ~8% of the time).
3. The ER Triage Extractor
What it does. Every emergency department note at KHCC is read by the pipeline. It extracts presenting complaint, vital sign abnormalities, suspected oncologic emergencies (tumor lysis, neutropenic fever, spinal cord compression, hypercalcemia of malignancy), and a structured triage acuity score.
What it produces. A structured row per ER visit. Feeds the ER outcomes dashboard, the febrile-neutropenia prediction model, and a weekly review that the medical oncology service uses to find missed admissions.
Why it matters. Oncologic emergencies are missed in the ER more often than anyone wants to admit. A patient with neutropenic fever who is sent home with “viral syndrome” can be dead in 48 hours. The extractor flags every ER note where the AI suspects neutropenic fever or tumor lysis is even possible, and the on-call hem-onc fellow reviews the list within an hour.
Tech inside. Same stack: GPT-4.1-mini + PydanticAI + Databricks. Higher false-positive tolerance than the pathology pipeline (better to over-flag).
4. The Chemotherapy Preparation Checker
What it does. Before a chemotherapy order is dispensed, the pipeline reads the order against the patient’s most recent labs, weight, height, allergies, and prior chemotherapy history. It checks for dose-banding errors (e.g., a Cisplatin dose calculated against last month’s BSA when the patient has lost weight), for renal-dose-adjustment errors (Cockcroft-Gault below 50 with a nephrotoxic agent still at full dose), and for cumulative-dose ceilings (Doxorubicin past 450 mg/m² lifetime).
What it produces. A structured alert that goes back to the prescribing physician and the pharmacy. Most alerts are not errors — they’re confirmation that a manual override was intended. About 1 in 200 are genuine catches.
Why it matters. Chemotherapy dosing errors are among the most dangerous sources of preventable harm in oncology. KHCC’s pharmacy has had a manual second-check for years. The pipeline is the third check, and it is the one that runs in two seconds at 3 AM when the manual second-checker is asleep.
Tech inside. Mostly deterministic — dose math, threshold comparisons, history lookups. The LLM is used only for parsing nonstandard order notes (free-text protocol modifications). Strict logging and audit trail; every alert is permanent.
5. The Vancomycin TDM Module
What it does. Vancomycin is a renally cleared antibiotic with a narrow therapeutic window. The pipeline reads each vancomycin trough level, the current creatinine, the current dose, and computes whether the next dose should be adjusted, held, or escalated. It uses Bayesian dose prediction with population pharmacokinetic priors specific to the KHCC cohort.
What it produces. A recommendation that goes to the clinical pharmacist, who then approves or modifies it before it goes back to the prescriber. Closed loop, but the human is always in it.
Why it matters. Suboptimal vancomycin dosing in oncology patients — who are immunocompromised, often have shifting renal function, and frequently fail empiric coverage — is associated with worse outcomes. The pipeline beats manual nomograms in both AUC-target attainment and time-to-therapeutic-trough.
Tech inside. Pure pharmacokinetics, not LLM. R + a Bayesian library for the dose prediction. Listed here because it lives in the same aidi_catalog and uses the same eval scaffolding.
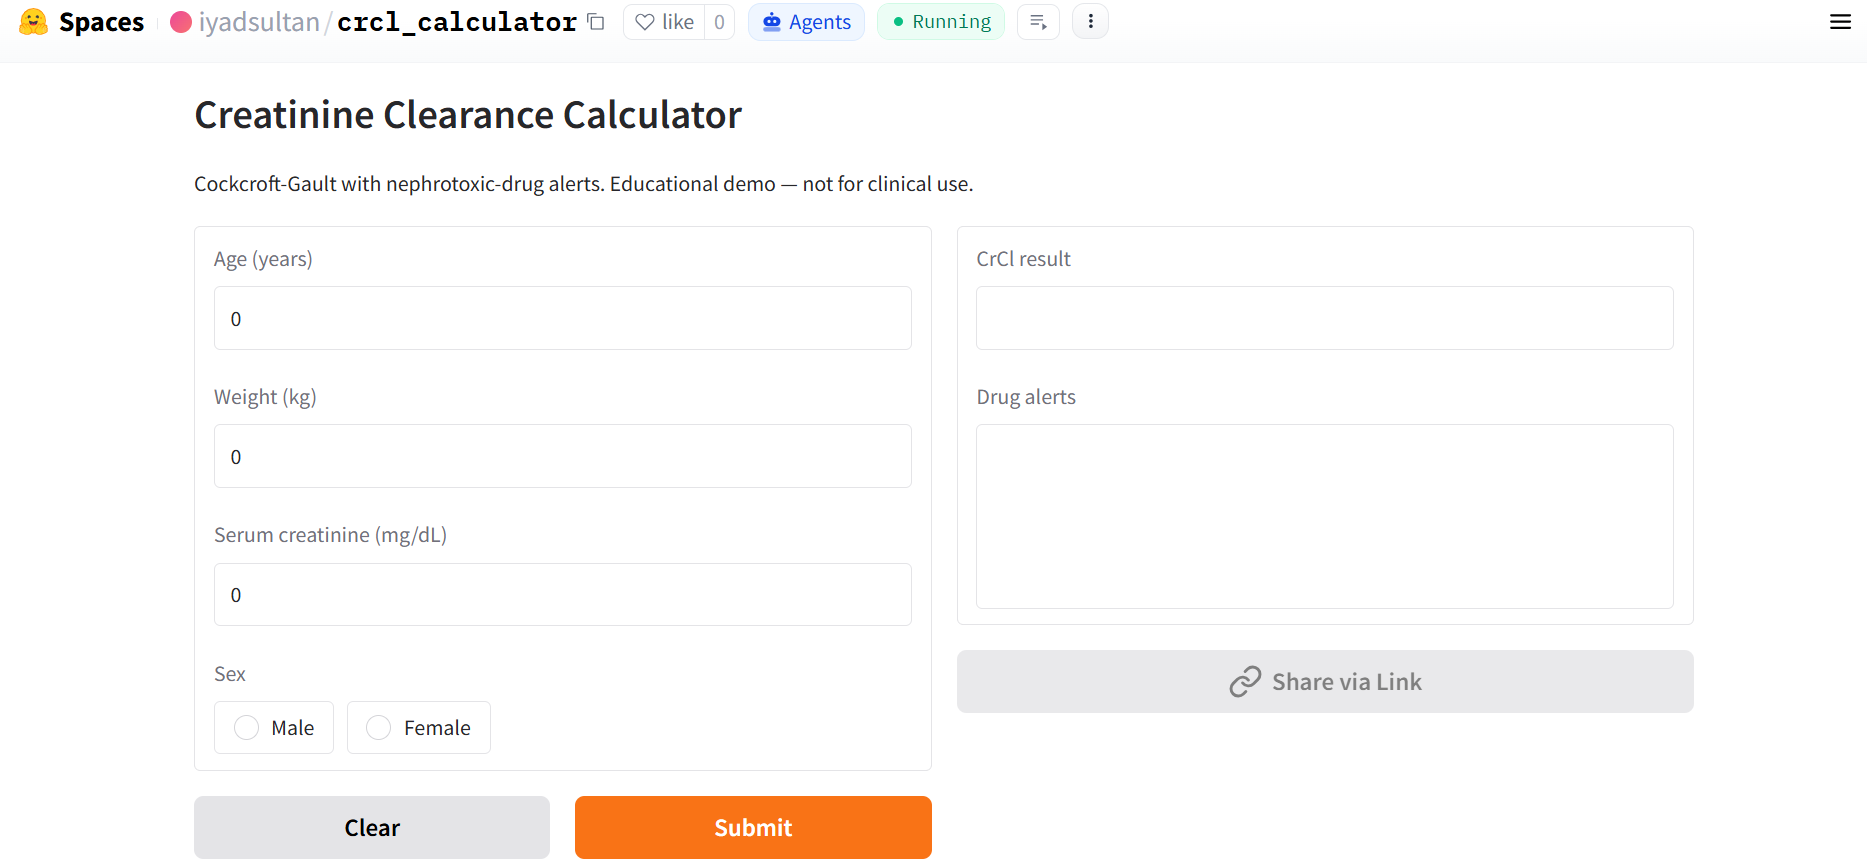
6. The Cockcroft-Gault Clearance + Nephrotoxic Drug Alerter
What it does. Computes estimated creatinine clearance using the Cockcroft-Gault formula for every inpatient with a fresh creatinine. Cross-checks the active medication list against a curated list of nephrotoxic agents (vancomycin, aminoglycosides, cisplatin, methotrexate, acyclovir, contrast). If a patient’s clearance has dropped below the agent’s safety threshold, an alert fires.
The formula: Cockcroft-Gault estimates creatinine clearance in mL/min as ((140 − age) × weight in kg) / (72 × serum creatinine in mg/dL), with the result multiplied by 0.85 for females. It is an old equation. It is imperfect. It is also still the dose-adjustment formula used in the FDA labels for most renally cleared drugs, so it remains the operational standard.
What it produces. Pharmacy gets the alert. They confirm whether the agent needs to be dose-reduced, switched, or held. Most alerts are caught before the next dose is dispensed.
Why it matters. Renal-dose mistakes are a leading source of preventable adverse drug events in hospitals. Catching a vancomycin dose that’s about to be given to a patient whose CrCl just dropped from 65 to 35 is exactly the kind of thing computers should be doing for clinicians, not the other way around.
Tech inside. Pure arithmetic. No LLM. SQLite-backed reference list of nephrotoxic agents. This is the smallest complete project in this book — small enough to build end-to-end, from a blank folder to a running web app, in a single Claude Code session. Once you have finished Part 1, it makes an ideal first build of your own.
7. The Deceased-Patient Evaluation Cohort
What it is. Not a pipeline — an infrastructure choice. It is the frozen reference dataset that every other pipeline is graded against.
It consists of approximately 1,000 patients who have died at KHCC over the past five years, for whom a senior clinician has hand-annotated the ground truth for each pipeline’s task. For the pathology extractor, that means hand-extracted tumor stages. For the AKI pipeline, hand-graded KDIGO events. For the ER extractor, hand-labeled oncologic emergencies.
Why deceased patients? Three reasons. First, there is no risk of clinical use of test data leaking into a current treatment decision — the patients are dead. Second, the entire trajectory is fixed: nothing about a deceased patient’s record changes over time, so the eval is reproducible. Third, the cohort can be shared internally (within strict access controls) for prompt iteration without privacy concerns about prospective patients seeing AI predictions about themselves.
Why this is the single most important AI Office artifact. Every chapter of this book that mentions “the eval suite” is referring to this cohort. The single discipline that separates the AI Office from less-rigorous AI work in healthcare is: nothing ships without an eval. If you read no other paragraph in this chapter, read this one.
8. The Press Ganey and Patient Feedback Analyzers
What they do. KHCC, like most large hospitals, runs patient satisfaction surveys (Press Ganey and an internal Arabic-language equivalent). The free-text comments — tens of thousands per quarter — used to be read by a single person whose job was to scan for safety concerns. The AI Office pipelines now classify every comment by domain (food, nursing, doctor communication, environmental, billing), sentiment, and actionability score, then flag the small subset that mention safety events for human review within 24 hours.
Why they matter. Patient experience data is a leading indicator of organizational health. Catching a single comment that says “the nurse never came when I called overnight” within a day instead of three months is the difference between a fixable problem and a culture problem.
Tech inside. GPT-4.1-mini for the classification, an R + ggplot pipeline for the dashboards, a Word/PowerPoint generator for the quarterly executive briefings (Iyad’s office produces both).
9. The Post-Surgery Microbiology Cohort
What it does. Tracks every culture taken within 30 days of a surgical procedure at KHCC, classifies the organism, flags multidrug resistance (ESBL producers, carbapenem-resistant Enterobacterales, carbapenem-resistant Pseudomonas aeruginosa, and other multidrug-resistant patterns), and produces stratified reports per surgical service (urology, ENT, breast, ortho, neuro, GI). Identifies whether the patient had an implant in place at the time, since implant-associated infections behave very differently.
Why it matters. Surgical site infection surveillance is required for accreditation and for choice of empiric coverage. Doing it manually is slow; doing it with this pipeline is overnight.
10. The Clinical Reports Generator
What it does. Generates publication-ready R Markdown clinical analyses end-to-end: cohort table, Kaplan-Meier curves, Cox regression, calibration plots, a methods section. The user supplies the CSV; the pipeline supplies the manuscript skeleton.
Why it matters. It collapses what used to be a week of biostatistician time into about an hour of clinician supervision. KHCC’s bone marrow transplant outcomes paper, the post-surgery microbiology AMR paper, and several ongoing Wilms tumor analyses have all gone through this generator first.
The pattern
Every project above is the same shape:
- Source of truth: a VistA table or a CSV.
- A
silvercleaning pass: SQL + Python on Databricks. - An optional LLM extraction or classification step: Azure OpenAI GPT-4.1-mini, structured by Pydantic.
- A
goldtable that downstream code reads. - A dashboard, an email, or a closed-loop alert that puts the result in front of a clinician.
- An eval suite against the deceased-patient cohort that catches regressions.
- A hook or audit log that keeps PHI out of places it shouldn’t go.
If you understand that shape, you understand every example in the rest of the book.
🧠 Remember. The hard part is never the model. The hard part is the plumbing — getting data in, extracting cleanly, getting the answer to the right human, verifying nothing broke, doing it again tomorrow. The rest of this book is mostly about that plumbing.
Now we can go meet Claude Code.